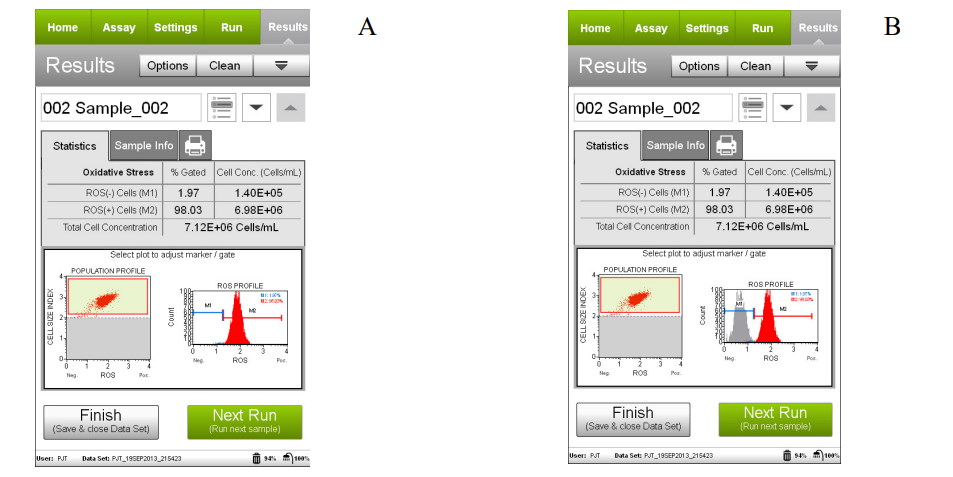
Figures A and B show results obtained from 143B cells treated with 200 μM Menadione for 3 hours and stained with the Muse® Oxidative Stress Kit, then acquired on the Guava® Muse Cell Analyzer. Figure A shows results without displaying an overlaid histogram, while Figure B shows the same results with a histogram overlay of the negative control. The statistics show the cells/mL in the stained cell sample and the percentages of each population. The dot plot shows ROS vs Cell Size and the histogram shows ROS staining.
shows the Viability vs Cell Size; the second plot shows the Viability vs Nucleated Cells plot
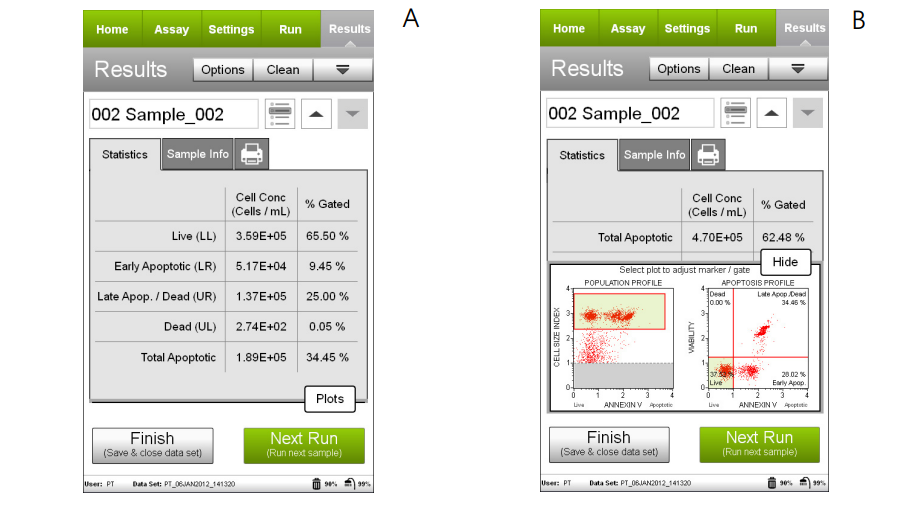
Figures A and B. Example Data: Results obtained from Jurkat cells induced to apoptosis with 1 μM staurosporine and stained with Muse® Annexin V & Dead Cell Kit and acquired on the Muse® Cell Analyzer. Figure A shows results without dot plots, while Figure B shows the same results with the optional dot plots. The statistics show the cell concentration in the stained cell sample and the percentages of the total represented by each population.
The first plot in Figure B shows Annexin V vs. Cell Size; the second plot shows Viability vs. Annexin V.
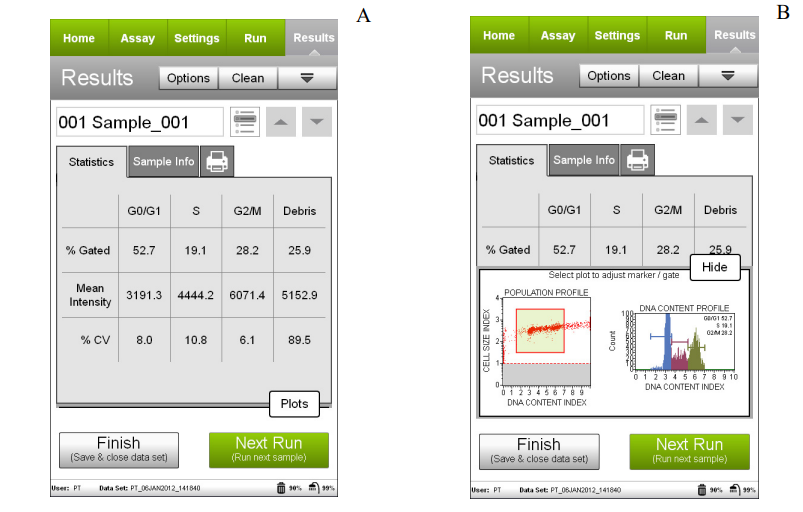
Figures A and B. Example Data: Results obtained with the Muse® Cell Cycle software module using Jurkat cells stained with Muse® Cell Cycle reagent and acquired on the Muse® Cell Analyzer. Figure A shows results without dot plots, while Figure B shows the same results with the optional dot plots. The statistics show the percentage of cells in each population, the mean intensity for each peak, and the coefficient of variation (%CV) for each peak. The first plot in Figure B shows the DNA content vs the Cell Size Index dot plot; the second plot shows the distribution of the cell cycle phases (G0/G1, S, and G2/M) in histogram format. The DNA histogram results show the results for the percentage of cells in G0/G1 (M1), S (M2), and G2/M (M3).
- 세포 계수를 위한 균일한 현탁액을 얻기 위해 덩어리로 응집된 세포를 부드럽게 분해하도록 제조된 효소 시약입니다.
- suspension culture에 적응된 CHO-K1 세포주와 같이 세포 응집체를 형성하는 cell line의 경우, 덩어리의 염색이 균일하지 않거나 막혀서 Muse Count & Viability Reagent 단독으로는 정확하거나 일관된 결과를 산출하지 못할 수 있습니다. 이때 Cell Dispersal Reagent를 이용하여 현탁액 배양물을 분해하면 효과적입니다.
- 제공되는 정보 :
- Viable cell count (cells/mL)
- Total cell count (cells/mL)
- Percentage viability of sample - Cat. No. : MCH100107 (100T)
사용법
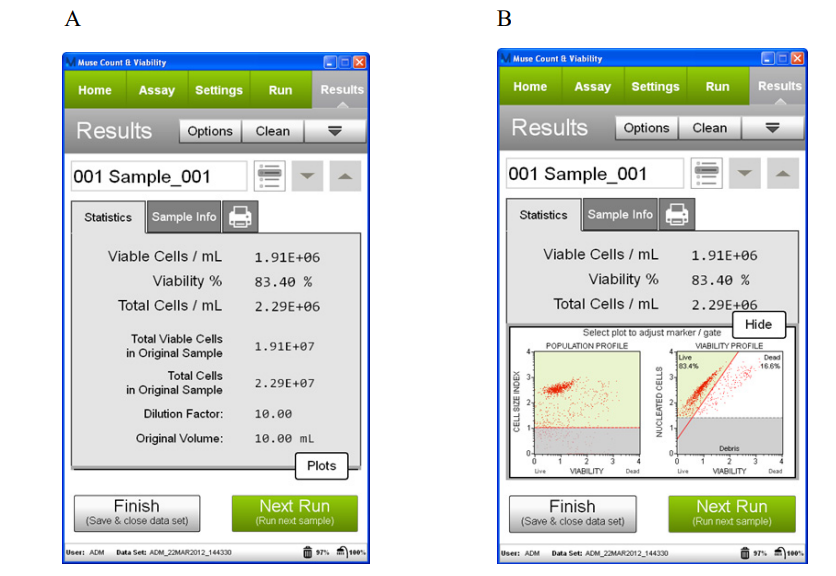
Figures A and B. Example Data: Results obtained with the Muse® Count & Viability software module using CHO-K1 cells, stained with Muse® Cell Dispersal Reagent and Muse® Count & Viability Kit, and acquired on the Muse® Cell Analyzer. Figure A shows results without dot plots, while Figure B shows the same results with the optional dot plots shown. The statistics show the concentration (cells/mL) of viable cells, the % viability, and the total cell concentration for the CHO-K1 cell sample shown. The first plot in Figure B shows the Viability vs Cell Size; the second plot shows the Viability vs Nucleated Cells.
Muse® Cell pathway Kit
- Pathway의 주요 단백질의 총 단백질량과 인산화된 단백질량을 검출합니다.
- 2 parameter를 이용하여 인산화된 타겟 단백질을 검출합니다.
- 제공되는 정보 :
- 비활성화된 세포의 비율
- 활성화된 세포의 비율(인산화)
- 비 발현 세포의 비율
- Cat. No. :
- MCH200104 : MAPK Activation Dual Detection Kit (Erk1/2)
- MCH200101 : H2A.X Activation Dual Detection Kit : Histone H2A.X
- MCH200102 : EGFR-RTK Activation Dual Detection Kit (EGFR)
- MCH200103 : PI3K Activation Dual Detection Kit (Akt)
- MCH200107 : Multi-Color DNA Damage kit : ATM, H2A.X
- MCH200108 : PI3K/MAPK Dual Pathway Activation Kit (Erk1/2, Akt)
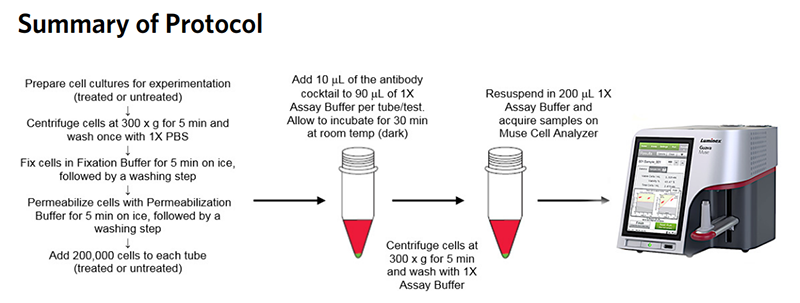
사용법
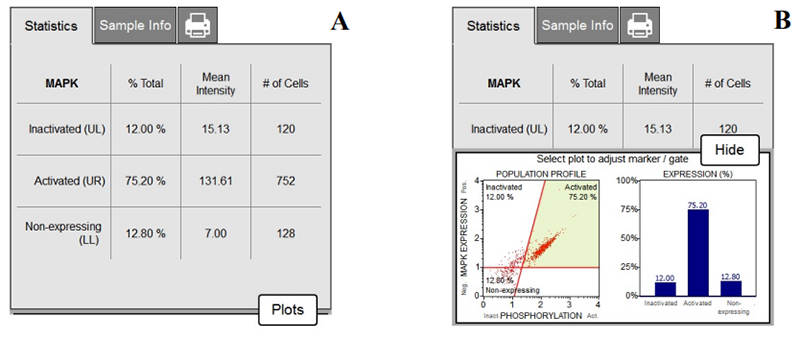
Figures A and B: Jurkat cells were exposed to 100 ng/mL PMA for 5 minutes to induce a MAPK signaling cascade response, fixed, permeabilized, and then stained with both anti-phospho-ERK 1/2 (Thr202/Tyr204, Thr185/Tyr187) and anti-ERK1/2 antibodies in multiplex. Samples were acquired using the Guava® Muse® Cell Analyzer and statistical results are shown above. Figure A shows the results summary, while Figure B shows results displayed by both dot plot and bar graph data.
The statistics captured in this assay show the relative percentages for each population as it is calculated within the total cell population. Cells which express ERK1/2 can be seen by the data on the top two quadrants of the dot plot (inactivated and activated, representing about 87.2% of the total cell population. But of this cell population, 75.2% is activated upon treatment, indicating activation of the MAPK signaling pathway is present. By presentation of both datasets, one can now determine the total: phospho ratio within their testing samples.
Muse® Immunology Kit
- PBMC 샘플에서 CD4, CD8, B cell의 비율 정량 분석합니다.
- no-wash, mix-and-read kit는 최소한의 샘플 준비로 정확한 결과를 쉽게 얻을 수 있습니다.
- 제공되는 정보 :
- Lymphocyte 내 타겟(CD4, CD8, B) 세포 농도 (cells/ul)
- Lymphocyte 내 타겟(CD4, CD8, B) 세포 비율 (%)
- PBMC 중 Total lymphocyte 농도 (cells/ul) - Cat. No. :
- MIM100103 : Muse Human B Cell Kit
- MIM100101 : Muse Human CD4 T Cell Kit
- MIM100102 : Muse Human CD8 T Cell Kit
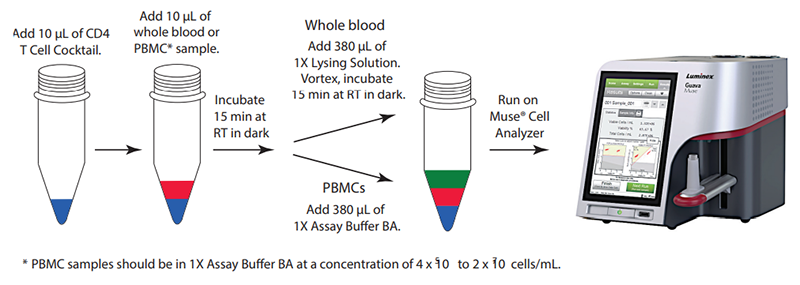
사용법
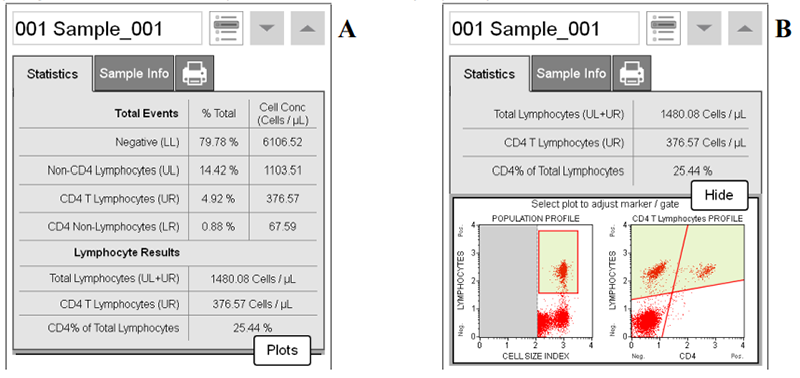
Figures A and B. Whole blood was stained with the Muse® Human CD4 T Cell Kit and acquired on the Muse Cell Analyzer. Figure A shows summary data, while Figure B shows results displayed with optional dot plots. The statistics show the percentages and the concentrations (cells/µL) for the results in each quadrant out of the total events. The Lymphocyte Results show the total lymphocyte concentration, the CD4 T-lymphocyte concentration, and the CD4 cell percentage of lymphocytes. The first plot in Figure B shows Cell Size Index vs. Lymphocytes and a lymphocyte gate, and the second plot shows CD4 vs. Lymphocytes.